
a generic tool for stochastic DALY calculation in R
Introduction
The DALY Calculator is designed to be used in an outcome-based as well as an agent-based approach. Depending on the approach, YLDs, YLLs, DALYs and incident cases and deaths can be computed for a combination of up to eight different disease categories of one outcome, or of up to eight different outcomes of one agent.
Following the Global Burden of Disease studies, the incidence-based approach was favored over the prevalence-based approach. The current version of the DALY Calculator is able to calculate DALYs for a basic incidence-based disease model with well-defined incidence and/or mortality rates per disease category or outcome.
The default age groups used by the DALY Calculator are the five age groups used by the GBD 1990 study: 0-4; 5-14; 15-44; 45-59; 60+. At least one combination of sex and age group has to be set in order to proceed with the DALY calculation.
To calculate DALYs with the DALY Calculator, the following five steps have to be followed:
1 Set the population table
Clicking the button opens the 'Population' window, where the number of males and females, per age group, can be entered. At least one combination of sex and age group has to be set.

2 Set the life expectancy table
The default life expectancy table used by the DALY Calculator is the Coale and Demeny model life-table West, level 26 and 25, which has a life expectancy at birth of 80 for males and 82.5 for females (Murray, 1994). However, the user can define his own life expectancy table, by accessing the 'Life Expectancy' window:
Settings > Life Expectancy

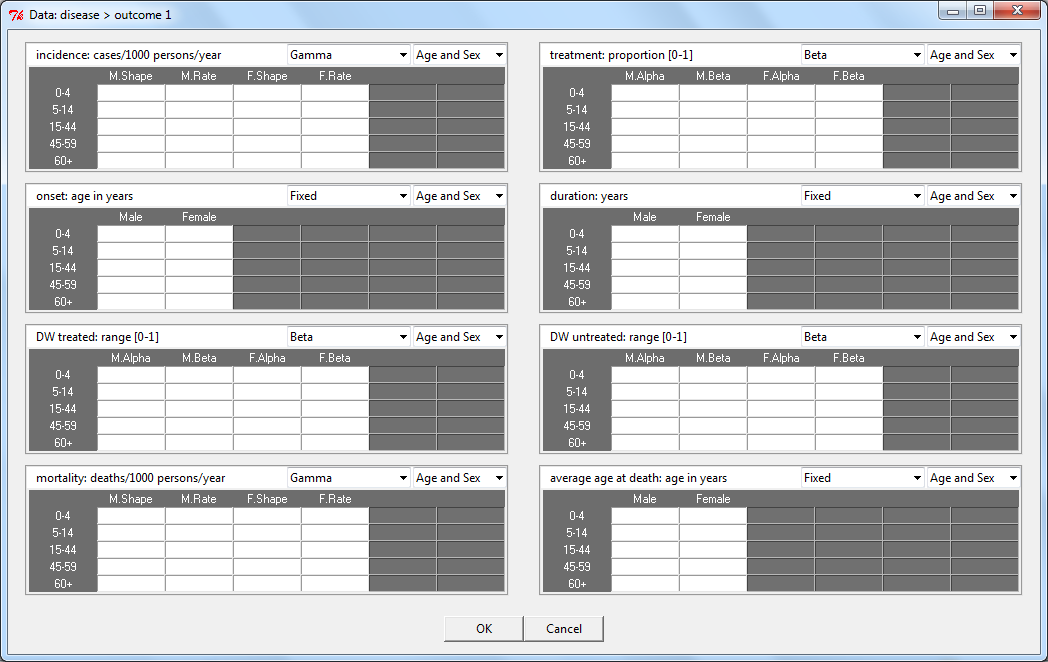
3 Set the data, per disease category or outcome
After entering the disease and outcome names, the epidemiological data and disability weights can be entered by clicking the button. For every parameter, the user can specify the distribution by selecting one of following:
- Beta-Pert (mode; min; max)
- Beta (alpha; beta)
- Gamma (shape; rate)
- Normal (mu; sigma)
- Lognormal-geometric (logmean; logsigma)
- Lognormal-arithmetic (mean; sigma)
- Uniform (min; max)
- Fixed
Next, the user has to select the specific level of stratification for every parameter. The following four stratification levels are available:
- Age and Sex (i.e., full stratification)
- Age (i.e., data is stratified by age group, but not by sex)
- Sex (i.e., data is stratified by sex, but not by age group)
- None (i.e., no stratification, data applies to total population)
For calculating the YLDs and incident cases, the following tables have to be completed:
- Incidence: number of new cases per 1,000 persons per year
- Treatment: proportion of patients receiving proper treatment; range [0-1]
- Onset of the disease: age of onset in years
- Duration of the disease: duration in years
- Disability Weight for treated cases: range [0-1]
- Disability Weight for non-treated cases: range [0-1]
For calculating the YLLs and deaths, the following tables have to be completed:
- Mortality: number of deaths per 1,000 persons per year
- Average age at death: age at death in years; based on these values, the DALY Calculator will compute the corresponding life expectancies according to the Life Expectancy table.
By default, the distributions of incidence and mortality will be set to "Gamma", those of the proportion treated and the disability weights to "Beta", and those of onset, duration and average age at death to "Fixed"; the level of stratification for all parameters is set to full stratification (i.e., "Age and Sex").
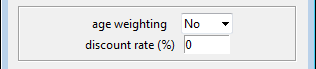
4 Set the age weighting and time discounting rates
The default social values applied by the DALY calculator are uniform age weights (i.e., no age weighting) and a zero discount rate. However, the user is given the possibility to define the required set of social values, and to alter these values to assess their influence on the final result.
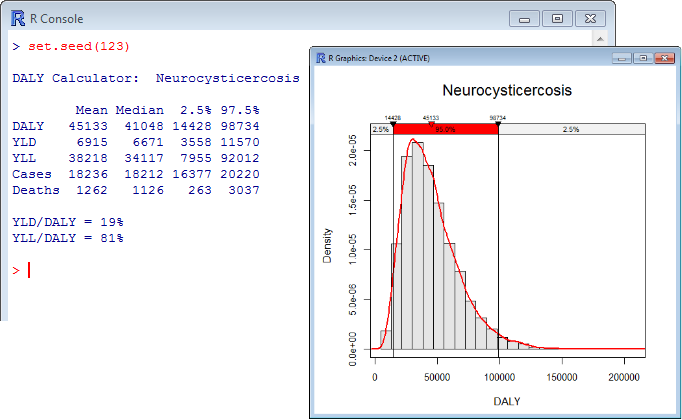
5 Calculate DALYs !
Clicking the button will read the data and compute the YLDs, YLLs, DALYs and incident cases and deaths per disease category/outcome and age/sex class. Standard, the overall mean, median and a 95% credibility interval of these results will be printed to the R Console, and a histogram of total DALYs, with accompanying density distribution and credibility interval, will be displayed.
A more detailed output of the DALY calculation can be obtained by changing the output settings in the 'Options' window:
Settings > Options

The following settings are possible:
- Age/Sex classes
- Results summed over different age/sex classes (default)
- Results shown per age/sex class
- Outcomes
- Results summed over different outcomes (default)
- Results shown per outcome
- Absolute/Relative
- Absolute values (default)
- Relative values, i.e., per 1,000 population
More advanced output, both numerically and graphically, can be obtained by saving the DALY Calculator output to an R object, and working with this object in the R environment. More details and some examples can be found here.